Applying GARCH and INGARCH models to papal conclaves
by Richard in28 May 2025
The purpose of this post is to use time series models to predict the length of papal conclaves.
A conclave is a secret vote which takes place to elect a new pope. Conclaves are all the rage right now. Not only was the film Conclave released in 2024, but the most recent conclave started on 7 May 2025 following the death of Pope Francis, and ended in the election of Leo XIV.
Even statisticians have become interested. A recent article in Significance magazine uses survival analysis techniques to estimate how long Leo’s reign will be (the posterior median is 13.9 years).
I’m interested in a different question: can we predict how long the conclave will last? According to a CBS article
There is no way to predict how long a conclave will take, but guidance can perhaps be taken from recent history.
Sounds like a job for time series models! Unfortunately, no sooner had I obtained the data than the new pope was elected, so I didn’t have time to make a prediction. But I suppose we can predict the next conclave instead.
Data
A good deal of interesting data on popes and cardinals is available at catholic-hierarchy.org. I scraped a data set of conclaves and plotted the length in days of every conclave since 1404.
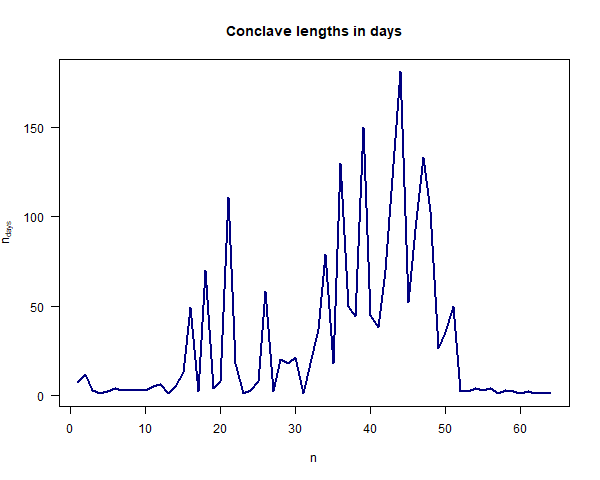
Surpisingly, neither the number of cardinals who voted, the average age of the cardinals, nor the time since the last conclave bear much relation to the length of the conclave in days. So the $x$-axis on the graph shows the ordinal number of the conclave (from 1 to 64).
It’s very clear that the variance of conclave lengths is not stable over time. So we need some sort of model which takes account of heteroskedasticity.
INGARCH model
Since we have integer-valued count data, my first idea was to use an INGARCH model. I first encountered these models when I was asked to model counts of cases of a certain disease. Previous authors had used ARIMA models, which produce confidence intervals which include negative values, which doesn’t necessarily make sense for count data. INGARCH models provide an alternative.
The INGARCH models are implemented in the tscount R package. The best model family for count data is usually negative binomial. The INGARCH(1,1) model assumes that the overdispersion parameter $\phi$ is fixed, and the mean $\lambda$ follows a process of the form
\[\lambda_t = \beta_0 + \beta_1 Y_{t-1} + \alpha_1 \lambda_{t-1}\]for some $\beta_0, \beta_1, \alpha_1 \in \mathbb{R}$.
The following R code can be used to fit the model to increasingly-long initial segements of the time series and predict the length of the next conclave in the sequence.
conclave <- read.csv("conclave_data.csv")

tsglm_models <- list()
for (i in 10:length(z)){
  tsglm_models[[i]] <- tsglm(ts=ts(conclave$n_days[1:i]), model=list(past_obs=1, past_mean=1), distr="nbinom", link="identity")
}
tsglm_models <- tsglm_models[!sapply(tsglm_models, is.null)]

predict_next_value <- function(model){
  pred <- predict(model, 1)
  CI <- pred$interval
}

# 95% intervals (the default)
CIs <- lapply(tsglm_models[!is.null(tsglm_models)], predict_next_value)
I have plotted the results on a log scale because some of the intervals are extremely wide. (Note that a lower bound of zero doesn’t make sense on a log scale so I have left it off.)
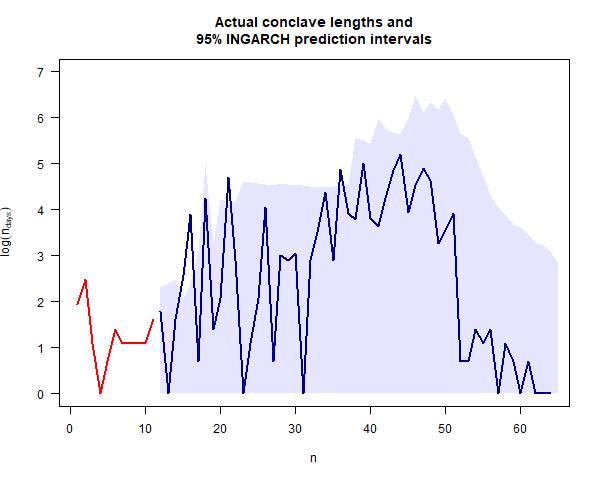
The 95% prediction interval for the length in days of the 2025 conclave is $[0, 22]$ and the prediction for the next conclave (whenever that occurs) is $[0, 17]$.
GARCH model
If you take the log of the conclave lengths (as in the previous plot) and plot the differences, you get the following plot
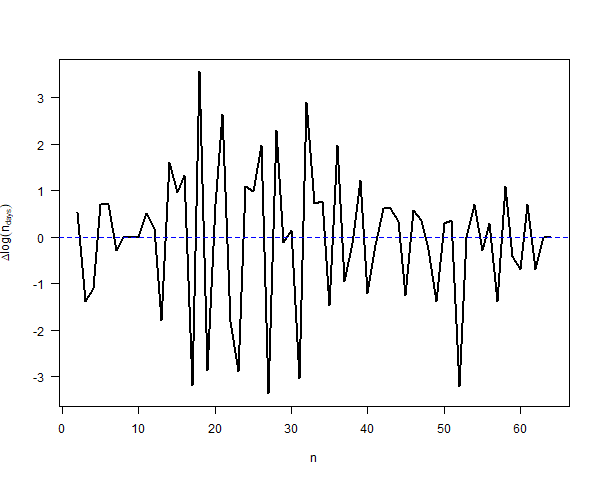
Even though this is quite a short time series, it’s clear that the variance is not constant. The natural model for this sort of situation is the GARCH model.
You can fit a GARCH(1,1) model to the “log returns” of the series of conclave lengths by using the following R code.
library(fGarch)
z <- diff(log(conclave$n_days))

garch_models <- list()
for (i in 10:length(z)){
  garch_models[[i+1]] <- garchFit(~1+garch(1,1),data=z[1:i],trace=F)
}
garch_models <- garch_models[!sapply(garch_models, is.null)]

predict_next_value <- function(model){
  pred <- predict(model, n.ahead=1)
  CI <- pred$meanForecast + 1.96 * pred$standardDeviation * c(-1, 1)
}

# confidence interval for the next value of z
CI_z <- lapply(garch_models[!is.null(garch_models)], predict_next_value)

# confidence interval for the next value of n_days
CI_garch <- sapply(CI_z, exp) * matrix(rep(conclave$n_days[11:64], 2), nrow=2, byrow=T)
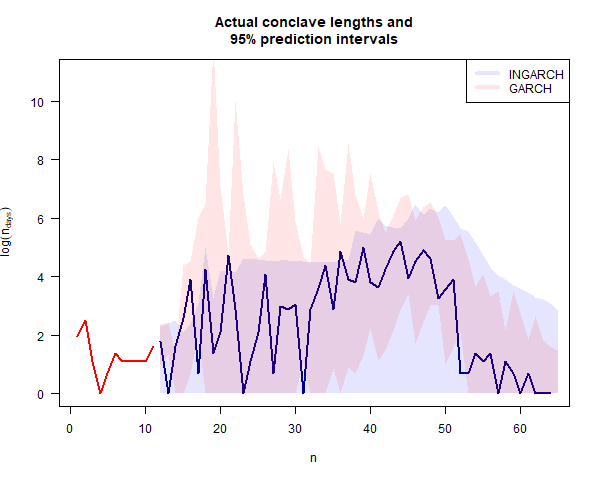
From the plot below, it’s clear that the GARCH predictions are much more sensitive to recent events than the INGARCH predictions. Nevertheless, the whole point of GARCH is that the model also takes into account the fact that periods of high variance have occurred in the past.
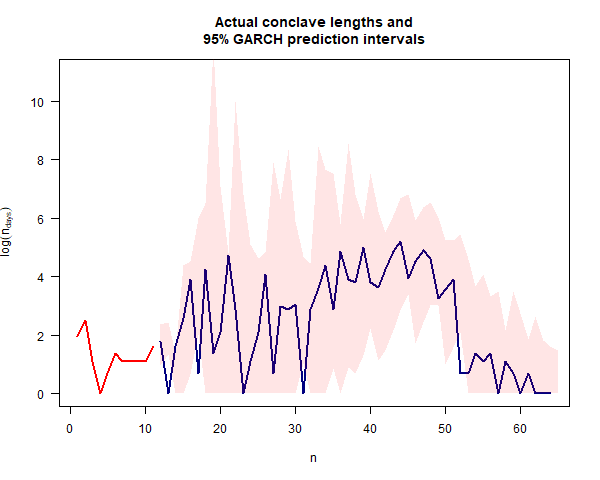
The 95% prediction interval for the length in days of the 2025 conclave is $[0.1, 5.1]$ and the prediction for the next conclave is $[0.1, 4.4]$.
The following plot compares the two models. On a log scale, there’s not much to choose between them. Personally, I think I prefer the GARCH model. After all, the data isn’t really discrete. The fact that it’s count data is just an artefact of rounding to the nearest day.
Conclusion
Even though “there’s no way to predict how long a conclave will take”, some crude time series analysis suggests that the next conclave can be expected to take between 0 and 5 days (or 0 and 17 days if you preferred the INGARCH model). When will it happen? From the Significance article, probably 10-20 years in the future.
And, of course, the density of popes in Vatican City is likely to remain steady at just over five popes per square mile!