Paradoxes in Credit Risk I: Simpson's Paradox
by Richard in30 Sep 2024
It’s 13 years since I started in data science (it was called data mining at the time) and in that time I have worked in many different fields. Every field has its own specialised vocabulary and ways of doing things. Moving from one to another is almost like being immersed in a new culture.
Credit Risk Modellers work for banks and other financial institutions. They build models to estimate the probability that a loan will default. The definition of default might vary from product to product, but generally it means that a certain number of payments are a certain number of days late. Loans which are in default are called “bad” and loans which do not default are “good”. The objective of the model builder is to build a model which will distinguish between the goods and the bads.
In this series, I want to describe a collection of paradoxical things which might be well-known to people working in the field, but surprising to people coming from outside it, even if they are familiar with the culture of some other application of data science.
Simpson’s Paradox
Simpson’s Paradox arises when you have a population which is divided into two groups. Some statistic appears to suggest one conclusion when you look at the two groups together, but the opposite conclusion if you look at the groups individually. This paradox is usually presented in the form of a two-way table, but it’s even easier to understand if you think of it in terms of linear regression, like in the following picture.
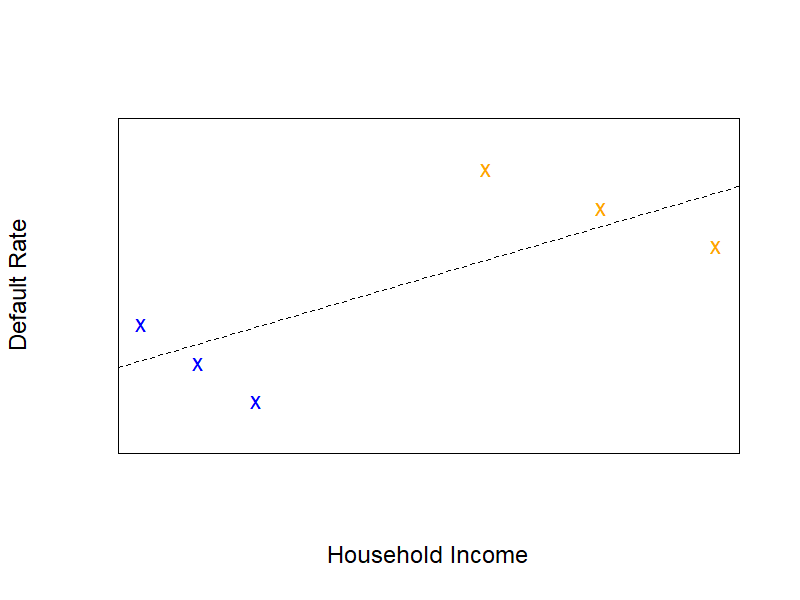
Here, imagine that we have two products that are sold to two different groups of people. One group (in blue) generally has lower income and the other group (in orange) generally has higher income. There are more defaults in the orange group, perhaps because we have sold them a riskier product (for example, a loan with a higher prinicpal and a longer term).
If you look at the groups individually, you will see that higher household income is associated with a lower rate of default. This is not very suprising, since it is likely that the higher your income, the easier it will be to pay off your loan. However, if you lump the blue and orange groups together and try to predict defaults based on household income, you now see that the relationship is reversed (the dotted black line). If you didn’t know that the data set was divided into two parts, it would look as if higher household income is associated with a higher rate of default, which is just the opposite of what actually happens!
And, indeed, if you built a model to predict default based on income (like the dotted line in the picture) then it would be correct to say that a higher income means a higher probability of default. But that’s because your model isn’t really predicting default; it’s predicting whether your point is blue or orange. By ignoring the fact that your data set contains two different products, you’re building a model to predict the wrong thing. And your model will perform poorly in practice. Maybe it will look like it’s OK, but you could have got vastly better performance by considering the blue and red groups individually.
Credit Risk
This paradox can arise in many different ways, and it usually isn’t as obvious as the above picture. You could have a population that’s naturally divided by geographical region, or by income type, or any number of other things, and it’s very easy to get a model that goes in the wrong direction.
Story time: I worked for one manager who decided that it would be a good idea to undertake a grand project to “unify our existing scorecards” (a scorecard is a name for a logistic regression model in the credit risk field.) One of the manager’s jobs was to go through 30 or so scorecards every month and evaluate how they were performing in order to decide which ones needed to be reworked. He didn’t like this chore and wanted to make his life easier. Instead of having a different scorecard for every product, he decided that we needed a single model which worked for all products at once (the company sold a variety of different products in different countries). Guess how that turned out? Even though the company was well aware of the Simpson’s Paradox problem, they went ahead and did it anyway, and took a massive hit to their performance. And that means that they lost money.
Ignoring Simpson’s Paradox can be costly!