Soothing Pastel Colours in R
by Richard in23 Nov 2017
While writing a report recently, I made a series of bar charts like the following one.
dat <- rep(1:5, 2)
barplot(dat, col=rep(c("red", "blue"), each=5))
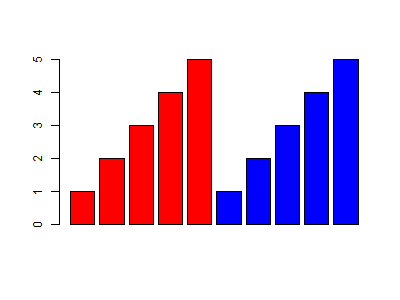
Upon review, the colours looked rather harsh, so I decided to convert them to something more soothing and professional-looking. I needed a pastellize function, but a search on the internet didn’t turn up anything.
This led me to read about pastel colours which Wikipedia describes as
the family of colors which, when described in the HSV color space, have high value and low to intermediate saturation.
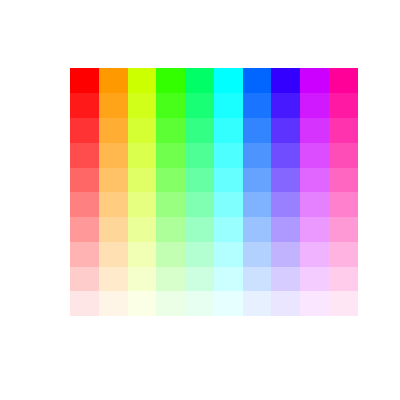
I had vaguely heard of the HSV colour space, but this was my first attempt to use it. I usually work with rgb values, in which a colour is described by a triple of red, green and blue, with the values of each running from 0 to 1. In HSV, colours are arranged on a cylinder as in the following picture from the Wikiepdia page.

It seems that pastellizing a colour will be a simple task. First, convert from rgb to HSV. Second, decrease the saturation. Third, convert back.
R features a handy rgb2hsv function which converts rgb values into HSV values. Unfortunately, in typical R fashion, there is no
hsv2rgb function. However, the algorithm for this conversion is described on the Wikipedia page as well, so it can be implemented
in R.
hsv2rgb <- function(x){
  # convert an hsv colour to rgb
  # input:  a 3 x 1 matrix (same as output of rgb2hsv() function)
  # output: vector of length 3 with values in [0,1]

  # recover h, s, v values
  h <- x[1,1]
  s <- x[2,1]
  v <- x[3,1]

  # follow the algorithm from Wikipedia
  C <- s*v

  # in R, h takes values in [0,1] rather than [0, 360], so dividing by
  # 60 degrees is the same as multiplying by six
  hdash <- h*6
  X <- C * (1 - abs(hdash %% 2 -1))

   if (0 <= hdash & hdash <=1) RGB1 <- c(C, X, 0)
   if (1 <= hdash & hdash <=2) RGB1 <- c(X, C, 0)
   if (2 <= hdash & hdash <=3) RGB1 <- c(0, C, X)
   if (3 <= hdash & hdash <=4) RGB1 <- c(0, X, C)
   if (4 <= hdash & hdash <=5) RGB1 <- c(X, 0, C)
   if (5 <= hdash & hdash <=6) RGB1 <- c(C, 0, X)

   # the output is a vector of length 3. This is the most convenient
   # format for using as the col argument in an R plotting function
   RGB1 + (v-C)
}
This function is not as fast or versatile as rgb2hsv since it is not vectorized, but it is good enough for now.
Now here is the pastellizer function.
pastellize <- function(x, p){

  # x is a colour
  # p is a number in [0,1]
  # p = 1 will give no pastellization

  # convert hex or letter names to rgb
  if (is.character(x)) x <- col2rgb(x)/255

  # convert vector to rgb
  if (is.numeric(x)) x <- matrix(x, nr=3)

  col <- rgb2hsv(x, maxColorValue=1)
  col[2,1] <- col[2,1]*p
  col <- hsv2rgb(col)

  # return in convenient format for plots
  rgb(col[1], col[2], col[3])
}
A quick demo, showing what happens when the parameter p is varied.
demo <- function(){
  plot(0,0, xlim=c(0,10), ylim=c(0,10), type="n", xaxt="n", yaxt="n", bty="n", xlab="", ylab="")
  for (i in 0:9){
    for (j in 10:0){
      rect(i,j-1,i+1,j, col=pastellize(rainbow(10)[i+1], j/10), border=NA)
    }
  }
}

demo()
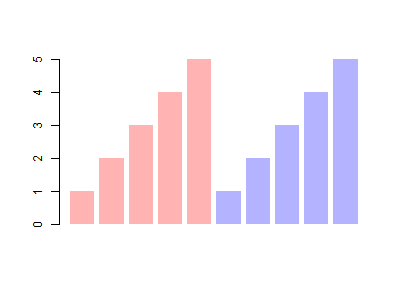
And finally, here is how to use it in a plot. Much more restful!
pastel_red <- pastellize("red", 0.3)
pastel_blue <- pastellize("blue", 0.3)

dat <- rep(1:5, 2)
barplot(dat, col=rep(c(pastel_red, pastel_blue), each=5), border=NA)
# border=NA removes black borders from the bars
Happy pastellizing!